
Examples for the Waterfall 3D Chart can be found in the SciChart WPF Examples Suite which can be downloaded from the SciChart Website or our SciChart.WPF.Examples Github Repository.
The Waterfall chart obeys Palette rules similar to that of the 3D SurfaceMesh Chart. Please have a look at this article for SurfaceMesh palettes to see the types of palette available and how to declare them. Palettes which may be applied to the 3D Waterfall chart include:
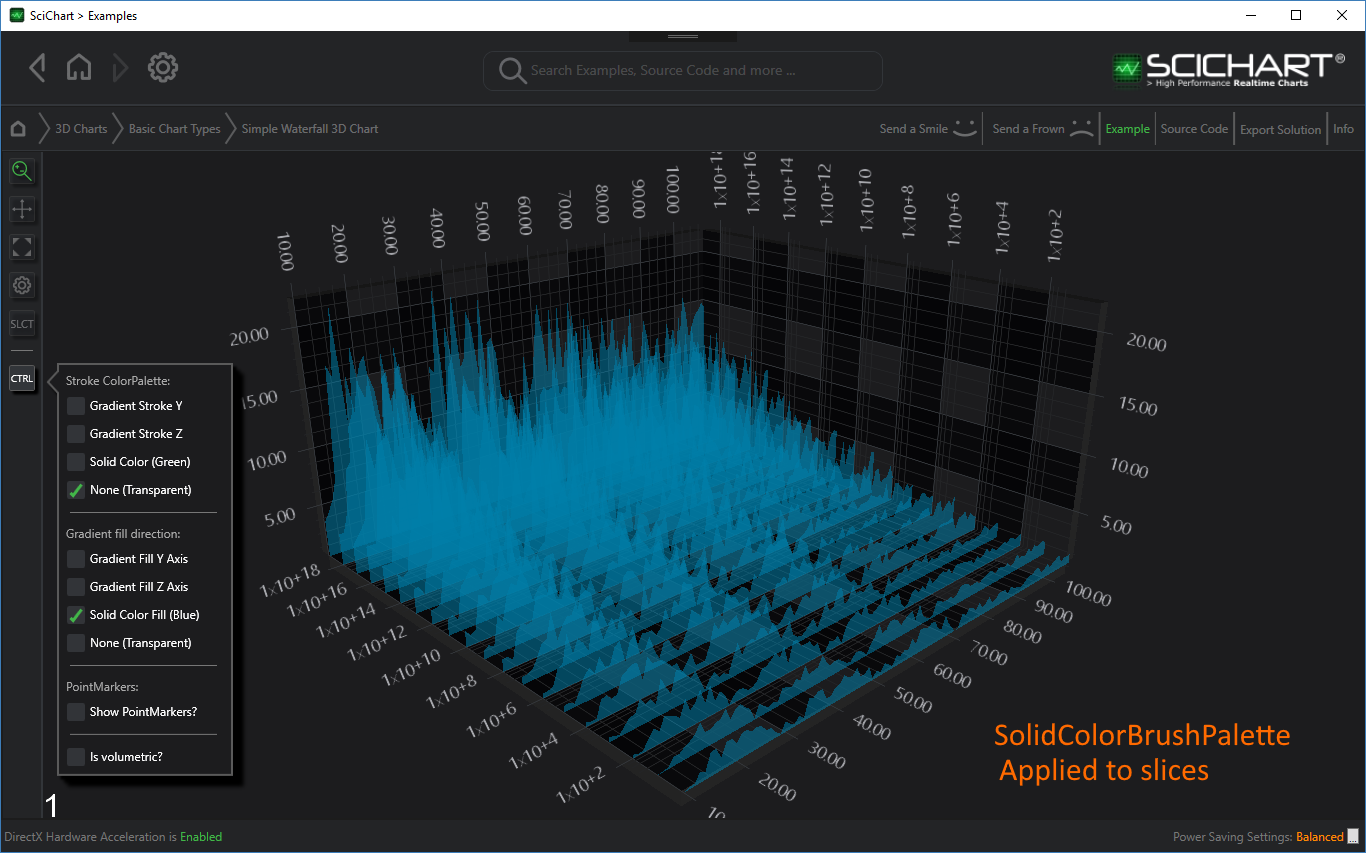
- SolidColorBrushPalette - applies a solid color the waterfall slice or stroke
- GradientColorPalette - maps a LinearGradientBrush to the slice or stroke, where heights map to successive colors.
Applying Palettes to the Waterfall Slice Fill
The properties which allow paletteing of the Waterfall Slices are WaterfallRenderableSeries3D.ZColorMapping or YColorMapping.
These proeprties are mutually exclusive, you should set one or the other to apply palettes in the Z direction or Y direction.
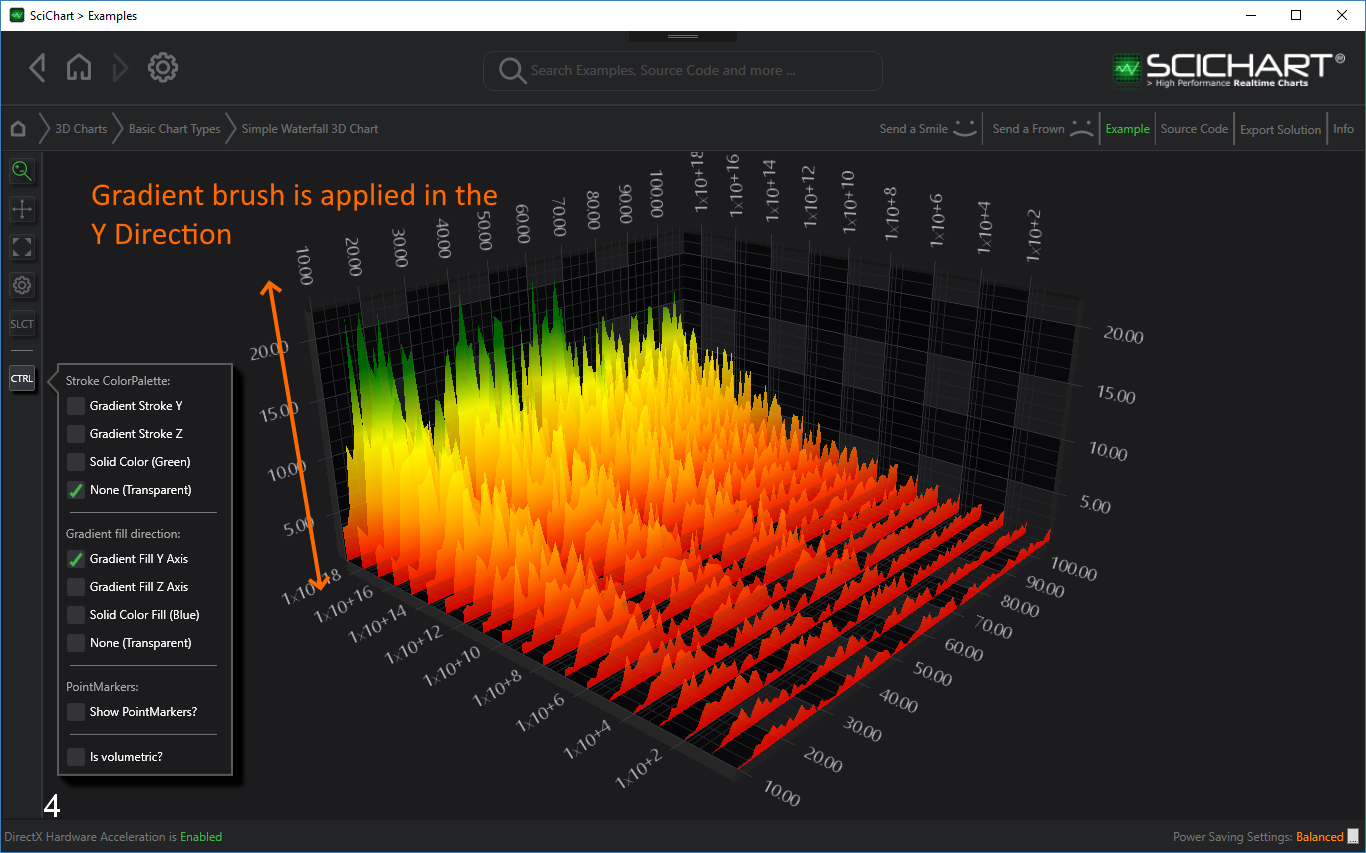
As an example of how to apply a GradientColorPalette to the Y-direction (up), see below:
This will result in the following output:
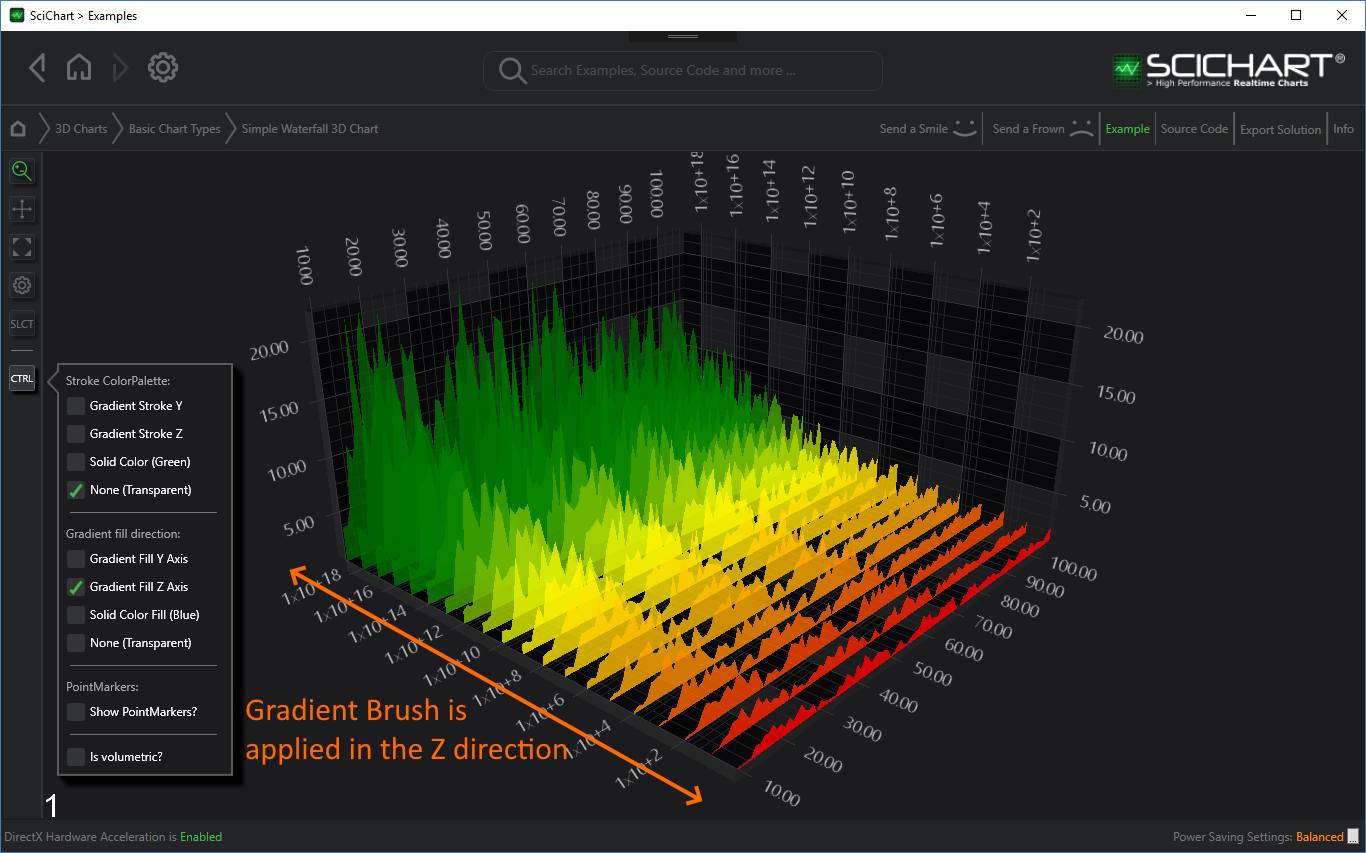
If the same GradientColorPalette is applied in the Z-direction, then you get this effect.
Also, the Waterfall3D Chart will accept SolidColorBrushPalette, which allows you to set a constant color for each slice.
Applying Palettes to the Waterfall Slice Stroke (Outline)
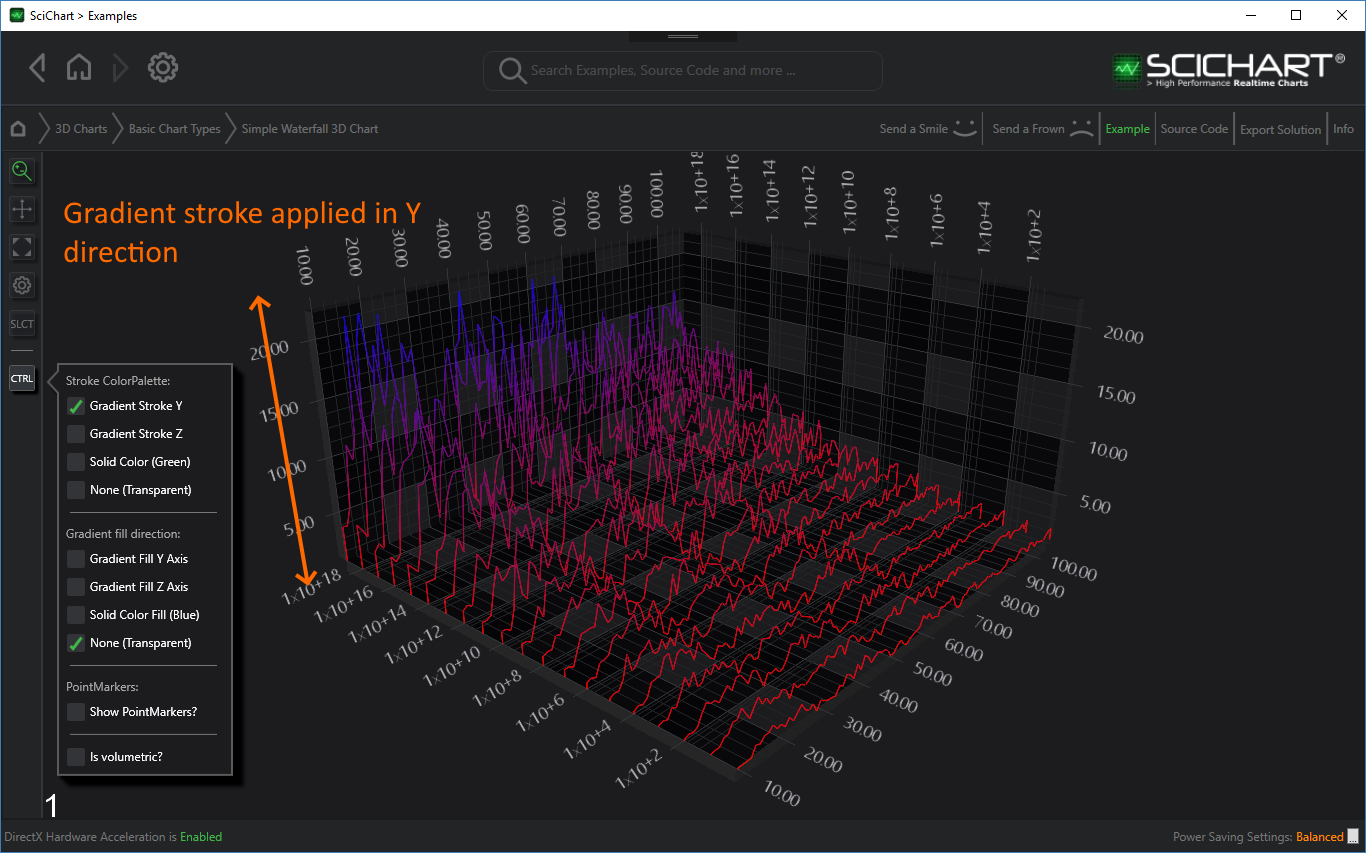
A new feature in SciChart WPF v5.4.0 allows you to apply a BrushColorPalette to the Stroke outline of Waterfall 3D Charts, which can be either a GradientColorPalette or a SolidColorBrushPalette.
The Brush may be set in the Y direction (Up) or the Z direction (horizontally) as follows:
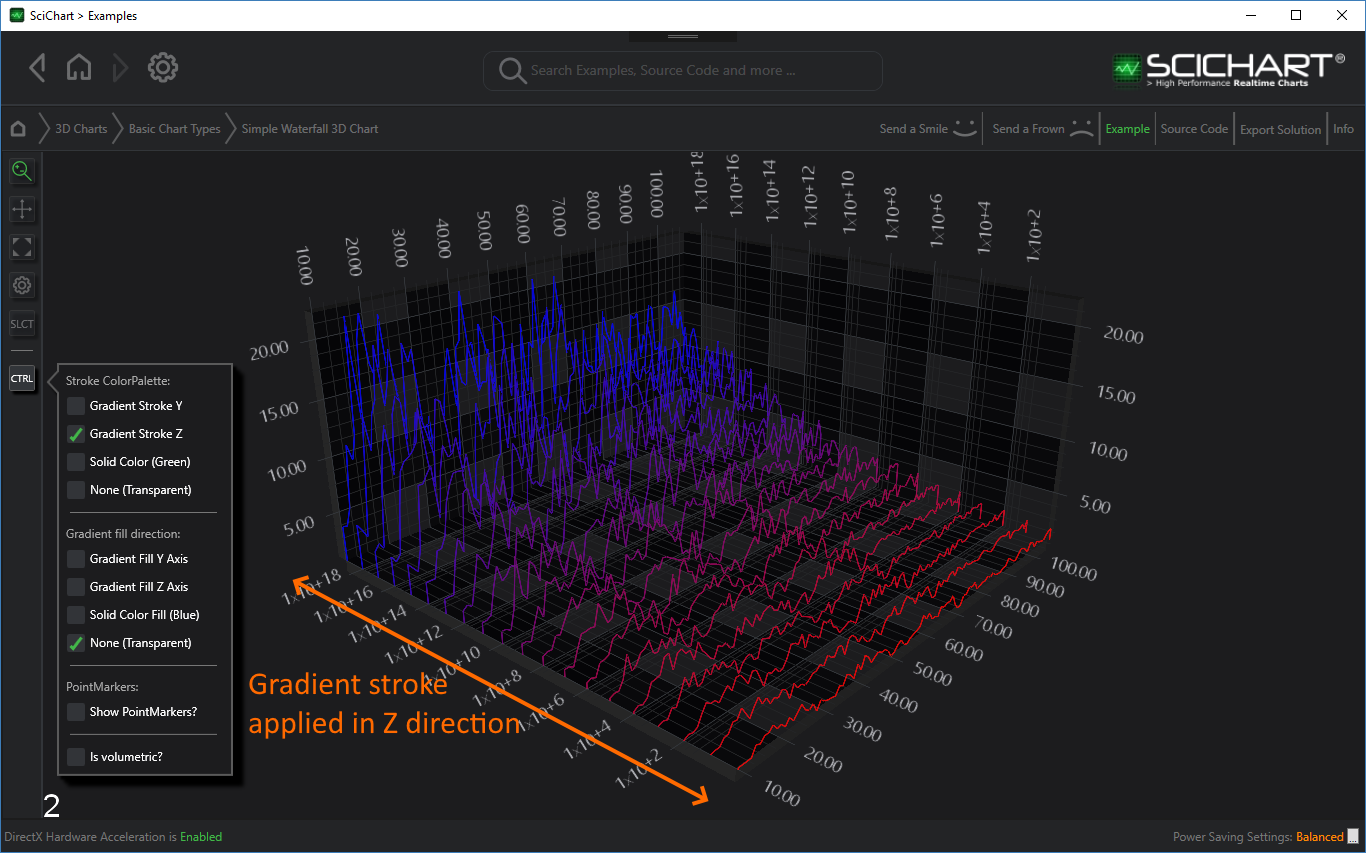
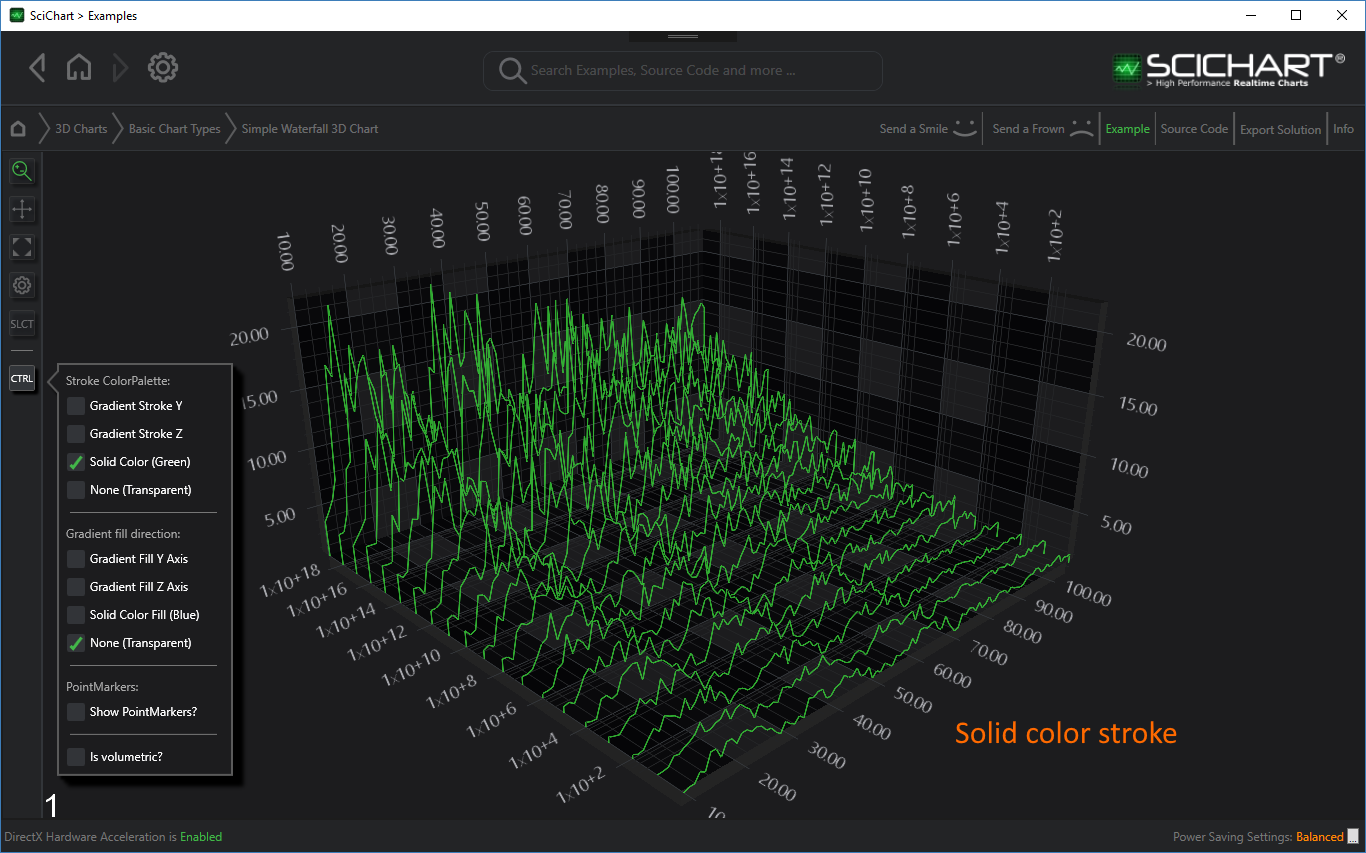
Combinations of Solid, Gradient color Fill and Stroke can be applied to get the desired effect on a waterfall chart.